Skip to content
-

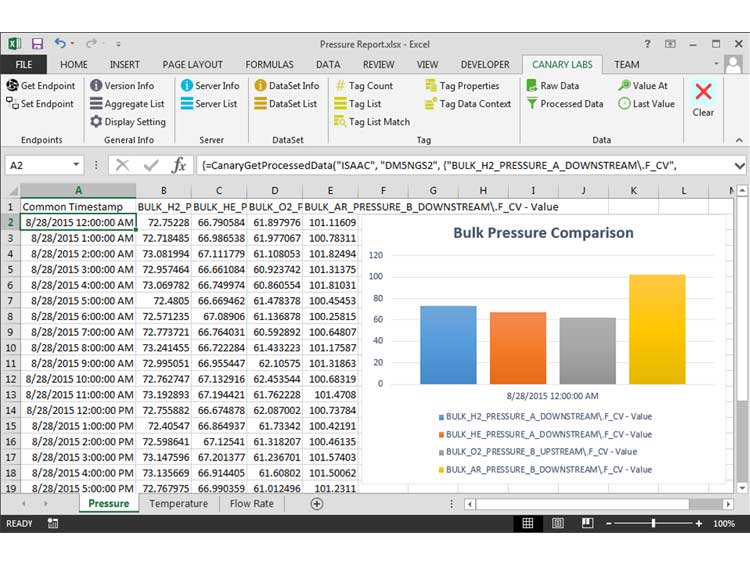
Canary Lab's Reports
Pull your data into Excel using our Excel Add-In. You can retrieve raw or processed data that can be used to generate reports, analyze data, and make business decisions.
Features:
- Ribbon ... Use buttons in the ribbon to open dialogs that will build or modify your calls to our Historian
- Connection ... Connect to remote Historians, or connect using credentials if security is turned on
- Raw Data ... Retrieve raw data from the historian. Choose display options for the data
- Processed Data ... Retrieve processed data from the historian. There are a number of aggregates that can be used
-
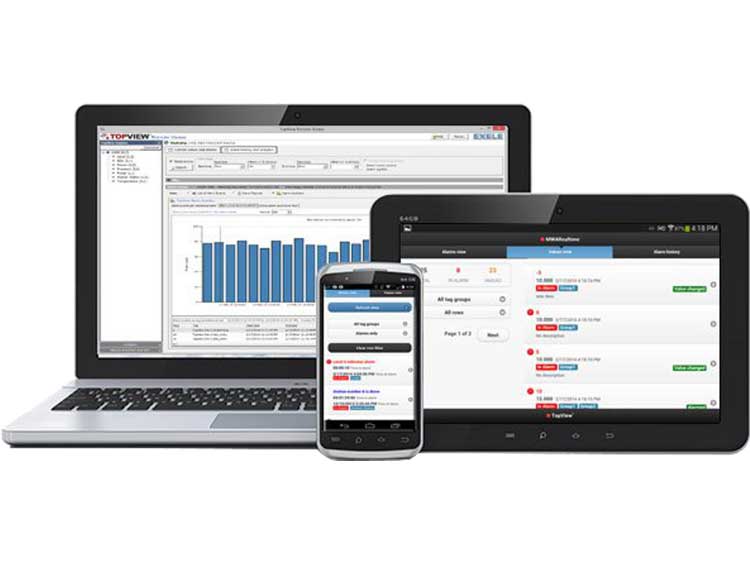
Canary Lab's Alarms
Use TopView® to monitor your process and automation data. Generate audible alarms, send e-mail notification, SMS/text notification, voice notification and SNMP traps.
Features:
- Monitor ... Access to values, alarms, and alarm history
- Notify ... Robust notification engine supporting a wide variety of devices
- Analyze ... Built-in alarm reports can be scheduled and emailed
- Scalable ... Monitor 100 tags or 100,000 tags
-
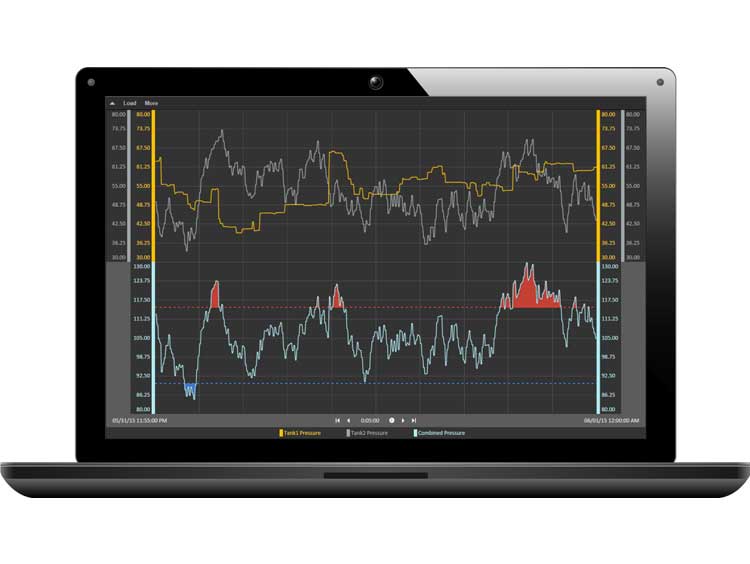
Canary Lab's Axiom
Maximize your data historian by analyzing process data in the most advanced trending software available. Innovative, easy to use, and feature rich, Axiom will transform your ability to trend process data and gather knowledge from your data historian.
Features:
- Ad Hoc Trends ... Add or remove trends quickly using our browse dialog to pick which trends you want to view
- Calculated Trends ... Use standard calculator operations to add a calculated trend based on one or more trends
- Link Scales/Bands ... Link scales of two or more trends so their data is displayed between the same ranges. Link bands to overlap trends
- Limit Lines ... Set limit lines for a trend. Use limits to draw a horizontal line across the screen, to fill in space between a limit and the trend, or to change the color of the trend
- Value Cursor ... Use your cursor to hover over the chart and view the values as you move your mouse
- Zoom ... Quickly zoom in on a range of data to examine it more closely
-
Canary Lab's Data Historian
Our process data historian writes and retrieves historical data with industry leading speed. It can store millions of tags accurately and reliably without any data management.
Features:
- Scalable ... capable of storing data for millions of tags
- Fast Read/Write ... Writes up to 4,000,000 points per second
- Data Handling ... Handles sub second data down to 100 nanoseconds
- Data Integrity ... Lossless compression algorithms are used
- Data Accessibility ... OPC, HDA, and ODBC compatible. We also have an API
- Custom Views ... Custom hierarchical models of the data can be created
- Easy Administration ... Easy data management without a database administrator
- Limitless Storage ... No need to purge or optimize the database
- Tag Security ... Tag security so you have complete control of data access
Page load link